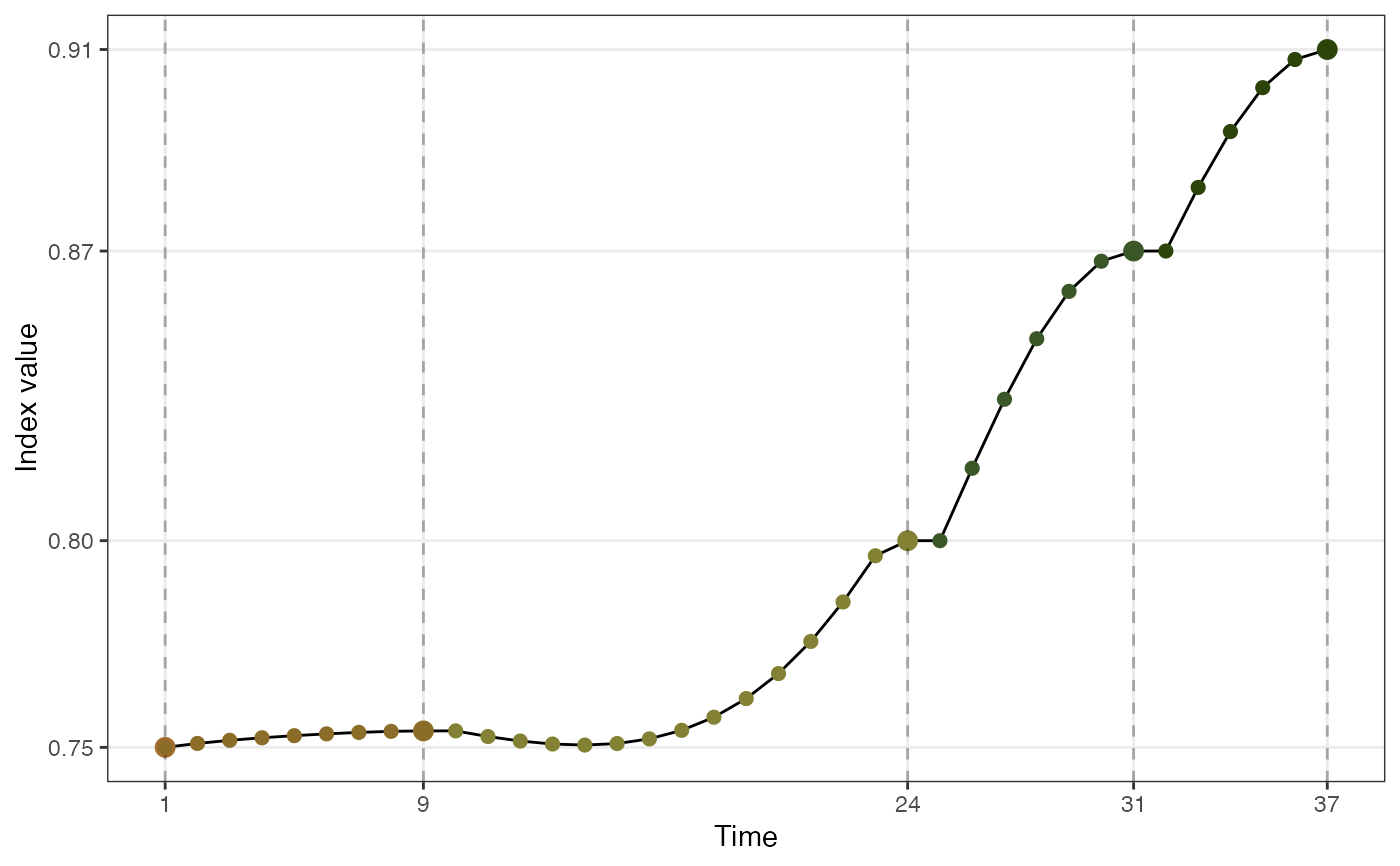
Trace the index value of search/ interpolation points in guided tour optimisation
Usage
explore_trace_interp(
  dt,
  iter = NULL,
  color = NULL,
  group = NULL,
  cutoff = 50,
  target_size = 3,
  interp_size = 1,
  accuracy_x = 5,
  accuracy_y = 0.01
)
Arguments
- dt
a data object collected by the projection pursuit guided tour optimisation in
tourr- iter
the variable to be plotted on the x-axis
- color
the variable to be coloured by
- group
the variable to label different runs of the optimiser(s)
- cutoff
numeric; if the number of interpolating points is smaller than
cutoff, all the interpolation points will be plotted as dots- target_size
numeric; the size of target points in the interpolation
- interp_size
numeric; the size of interpolation points
- accuracy_x
numeric; If the difference of two neighbour x-labels is smaller than
accuracy_x, only one of them will be displayed. Used for better axis label- accuracy_y
numeric; the precision of y-axis label
See also
Other main plot functions:
explore_space_start(),
explore_space_tour(),
explore_trace_search()
Examples
# Compare the trace of interpolated points in two algorithms
holes_1d_better %>%
  explore_trace_interp(interp_size = 2) +
  scale_color_continuous_botanical(palette = "fern")
#> map id to the x-axis
#> map tries to color

