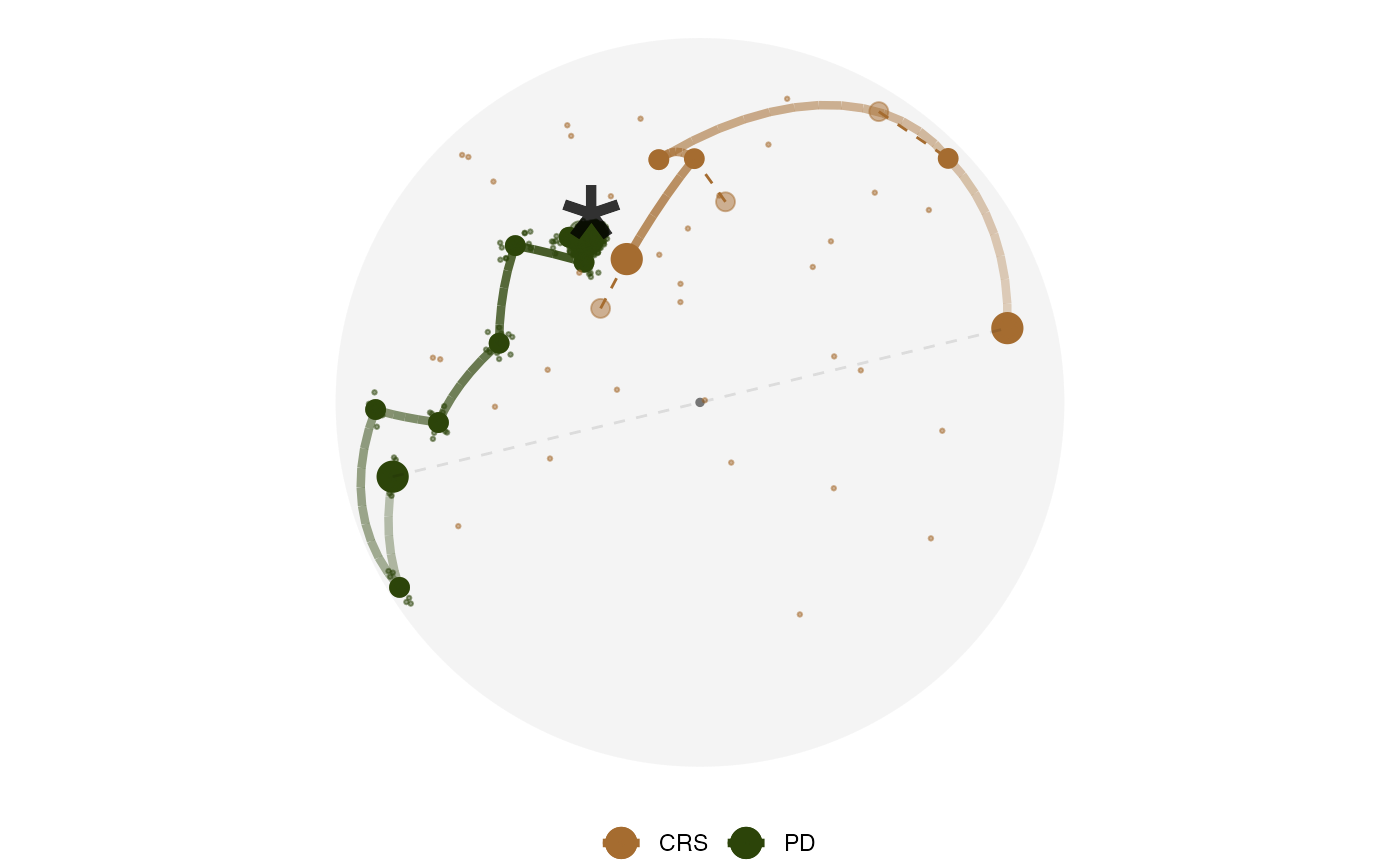
Plot the PCA projection of the projection bases space
Source:R/explore-space-pca.R
explore_space_pca.RdPlot the PCA projection of the projection bases space
Usage
explore_space_start(dt, group = NULL, pca = TRUE, ...)

explore_space_end(dt, group = NULL, pca = TRUE, ...)

explore_space_pca(
  dt,
  details = FALSE,
  pca = TRUE,
  group = NULL,
  color = NULL,
  facet = NULL,
  ...,
  animate = FALSE
)
Arguments
- dt
a data object collected by the projection pursuit guided tour optimisation in
tourr- group
the variable to label different runs of the optimiser(s)
- pca
logical; if PCA coordinates need to be computed for the data
- ...
other arguments passed to
add_*()functions- details
logical; if components other than start, end and interpolation need to be shown
- color
the variable to be coloured by
- facet
the variable to be faceted by
- animate
logical; if the interpolation path needs to be animated
See also
Other main plot functions:
explore_space_tour(),
explore_trace_interp(),
explore_trace_search()
Examples
dplyr::bind_rows(holes_1d_geo, holes_1d_better) %>%
  bind_theoretical(matrix(c(0, 1, 0, 0, 0), nrow = 5),
    index = tourr::holes(), raw_data = boa5
  ) %>%
  explore_space_pca(group = method, details = TRUE) +
  scale_color_discrete_botanical()
#> signs in all the bases will be flipped in group search_geodesic
#> Warning: Using `size` aesthetic for lines was deprecated in ggplot2 3.4.0.
#> ℹ Please use `linewidth` instead.
#> ℹ The deprecated feature was likely used in the ferrn package.
#>   Please report the issue at
#>   <https://github.com/huizezhang-sherry/ferrn/issues>.
#> Adding missing grouping variables: `method`


if (FALSE) { # \dontrun{
best <- matrix(c(0, 1, 0, 0, 0), nrow = 5)
dt <- bind_theoretical(holes_1d_jellyfish, best, tourr::holes(), raw_data = boa5)
explore_space_start(dt)
explore_space_end(dt, group = loop, theo_size = 10, theo_color = "#FF0000")
explore_space_pca(
  dt, facet = loop, interp_size = 0.5, theo_size = 10,
  start_size = 1, end_size = 3
  )
} # }
if (FALSE) { # \dontrun{
best <- matrix(c(0, 1, 0, 0, 0), nrow = 5)
dt <- bind_theoretical(holes_1d_jellyfish, best, tourr::holes(), raw_data = boa5)
explore_space_start(dt)
explore_space_end(dt, group = loop, theo_size = 10, theo_color = "#FF0000")
explore_space_pca(
dt, facet = loop, interp_size = 0.5, theo_size = 10,
start_size = 1, end_size = 3
)
} # }