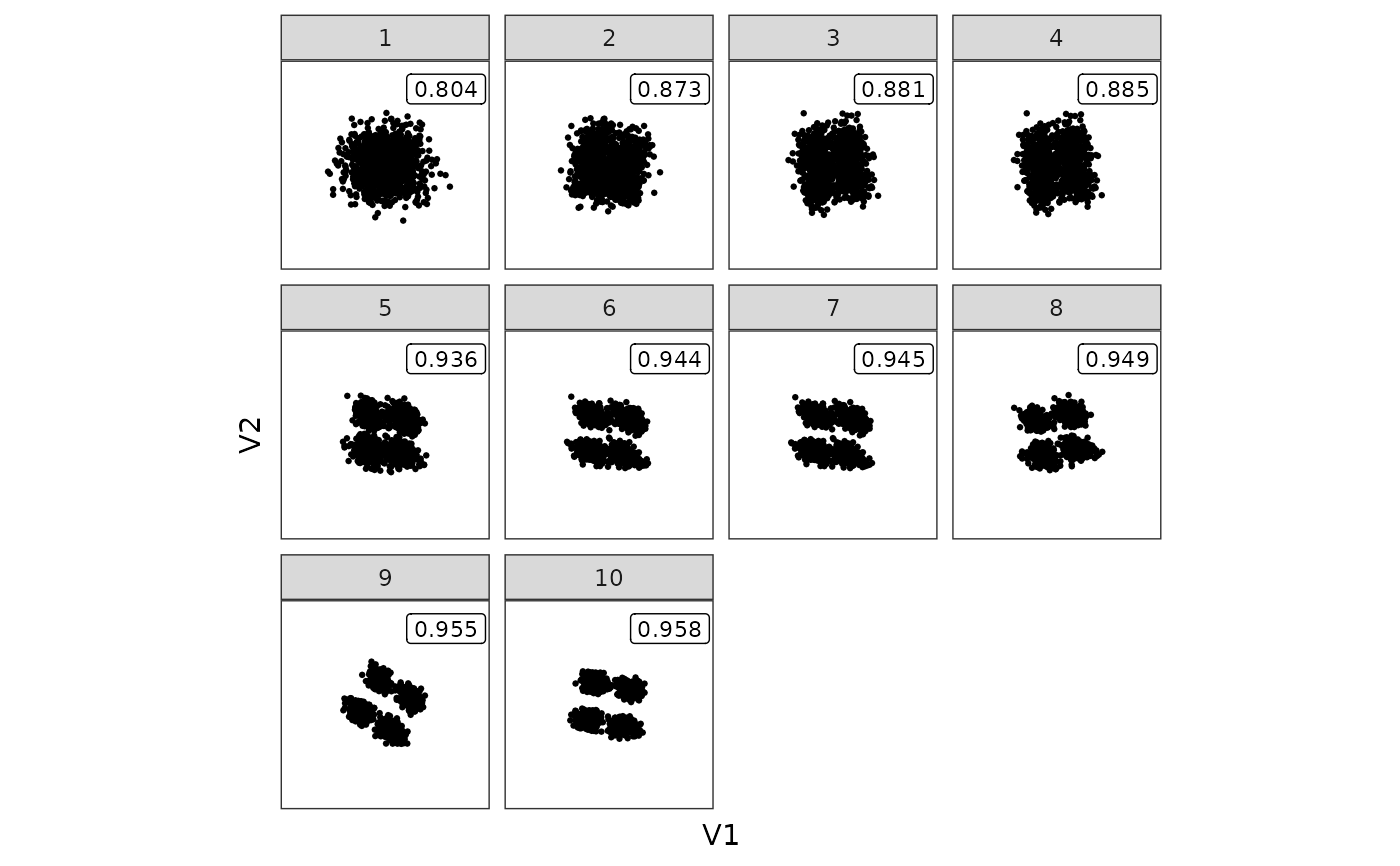
Plot the projection from the optimisation data collected from projection pursuit
Source:R/plot-projection.R
projection.RdPlot the projection from the optimisation data collected from projection pursuit
Usage
plot_projection(
  dt,
  data,
  id = NULL,
  cols = NULL,
  label = TRUE,
  animate_along = NULL,
  keep = 0.2
)

compute_projection(dt, data, id = NULL, cols = NULL)
Arguments
- dt
a data object collected by the projection pursuit guided tour optimisation in
tourr- data
the original data
- id
the grouping variable
- cols
additional columns to include in the plot
- label
logical, whether to label each panel by its index value
- animate_along
the variable to animate along
- keep
numeric, the proportion of the data to keep for animation (default is 0.2). Only used when `animate_along` is not NULL
Examples
library(dplyr)
holes_2d_jellyfish |>
  filter(loop == 1, tries %in% seq(1, 50, 5)) |>
  plot_projection(data = boa6)

if (FALSE) { # \dontrun{
library(dplyr)
# track the first jellyfish (loop == 1)
holes_2d_jellyfish |>
  filter(loop == 1) |>
  plot_projection(data = boa6, animate_along = tries, id = loop)
} # }
if (FALSE) { # \dontrun{
library(dplyr)
# track the first jellyfish (loop == 1)
holes_2d_jellyfish |>
filter(loop == 1) |>
plot_projection(data = boa6, animate_along = tries, id = loop)
} # }