mpg cyl  disp  hp drat    wt  qsec vs am gear carb
Mazda RX4           21.0   6 160.0 110 3.90 2.620 16.46  0  1    4    4
Mazda RX4 Wag       21.0   6 160.0 110 3.90 2.875 17.02  0  1    4    4
Datsun 710          22.8   4 108.0  93 3.85 2.320 18.61  1  1    4    1
Hornet 4 Drive      21.4   6 258.0 110 3.08 3.215 19.44  1  0    3    1
Hornet Sportabout   18.7   8 360.0 175 3.15 3.440 17.02  0  0    3    2
Valiant             18.1   6 225.0 105 2.76 3.460 20.22  1  0    3    1
Duster 360          14.3   8 360.0 245 3.21 3.570 15.84  0  0    3    4
Merc 240D           24.4   4 146.7  62 3.69 3.190 20.00  1  0    4    2
Merc 230            22.8   4 140.8  95 3.92 3.150 22.90  1  0    4    2
Merc 280            19.2   6 167.6 123 3.92 3.440 18.30  1  0    4    4
Merc 280C           17.8   6 167.6 123 3.92 3.440 18.90  1  0    4    4
Merc 450SE          16.4   8 275.8 180 3.07 4.070 17.40  0  0    3    3
Merc 450SL          17.3   8 275.8 180 3.07 3.730 17.60  0  0    3    3
Merc 450SLC         15.2   8 275.8 180 3.07 3.780 18.00  0  0    3    3
Cadillac Fleetwood  10.4   8 472.0 205 2.93 5.250 17.98  0  0    3    4
Lincoln Continental 10.4   8 460.0 215 3.00 5.424 17.82  0  0    3    4
Chrysler Imperial   14.7   8 440.0 230 3.23 5.345 17.42  0  0    3    4
Fiat 128            32.4   4  78.7  66 4.08 2.200 19.47  1  1    4    1
Honda Civic         30.4   4  75.7  52 4.93 1.615 18.52  1  1    4    2
Toyota Corolla      33.9   4  71.1  65 4.22 1.835 19.90  1  1    4    1
Toyota Corona       21.5   4 120.1  97 3.70 2.465 20.01  1  0    3    1
Dodge Challenger    15.5   8 318.0 150 2.76 3.520 16.87  0  0    3    2
AMC Javelin         15.2   8 304.0 150 3.15 3.435 17.30  0  0    3    2
Camaro Z28          13.3   8 350.0 245 3.73 3.840 15.41  0  0    3    4
Pontiac Firebird    19.2   8 400.0 175 3.08 3.845 17.05  0  0    3    2
Fiat X1-9           27.3   4  79.0  66 4.08 1.935 18.90  1  1    4    1
Porsche 914-2       26.0   4 120.3  91 4.43 2.140 16.70  0  1    5    2
Lotus Europa        30.4   4  95.1 113 3.77 1.513 16.90  1  1    5    2
Ford Pantera L      15.8   8 351.0 264 4.22 3.170 14.50  0  1    5    4
Ferrari Dino        19.7   6 145.0 175 3.62 2.770 15.50  0  1    5    6
Maserati Bora       15.0   8 301.0 335 3.54 3.570 14.60  0  1    5    8
Volvo 142E 21.4 4 121.0 109 4.11 2.780 18.60 1 1 4 2Elements of Data Science
SDS 322E
About me
I’m a Postdoc Fellow at UT Austin
I did my PhD at Monash University in Australia
I work on visualization and statistical computing.
I climb 🧗♂️ and swim 🏊

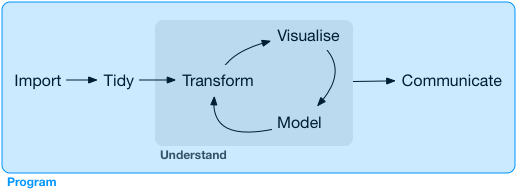
The big picture
Visualization with ggplot2
mtcars2 <- mtcars |>
  mutate(
    vs = ifelse(vs == 0, "V-shaped", "Straight")
    ) |>
  rename(Engine = vs)

mtcars2 |>
  ggplot(aes(x = mpg, y = disp,
             color = as.factor(cyl))) +
  geom_point() +
  facet_wrap(vars(Engine),
             labeller = label_both) +
  scale_color_brewer(
    palette = "Dark2",
    name = "Number of cylinders") +
  theme_bw() +
  theme(legend.position = "bottom") +
  xlab("Miles per gallon") +
  ylab("Displacement (cu.in.)")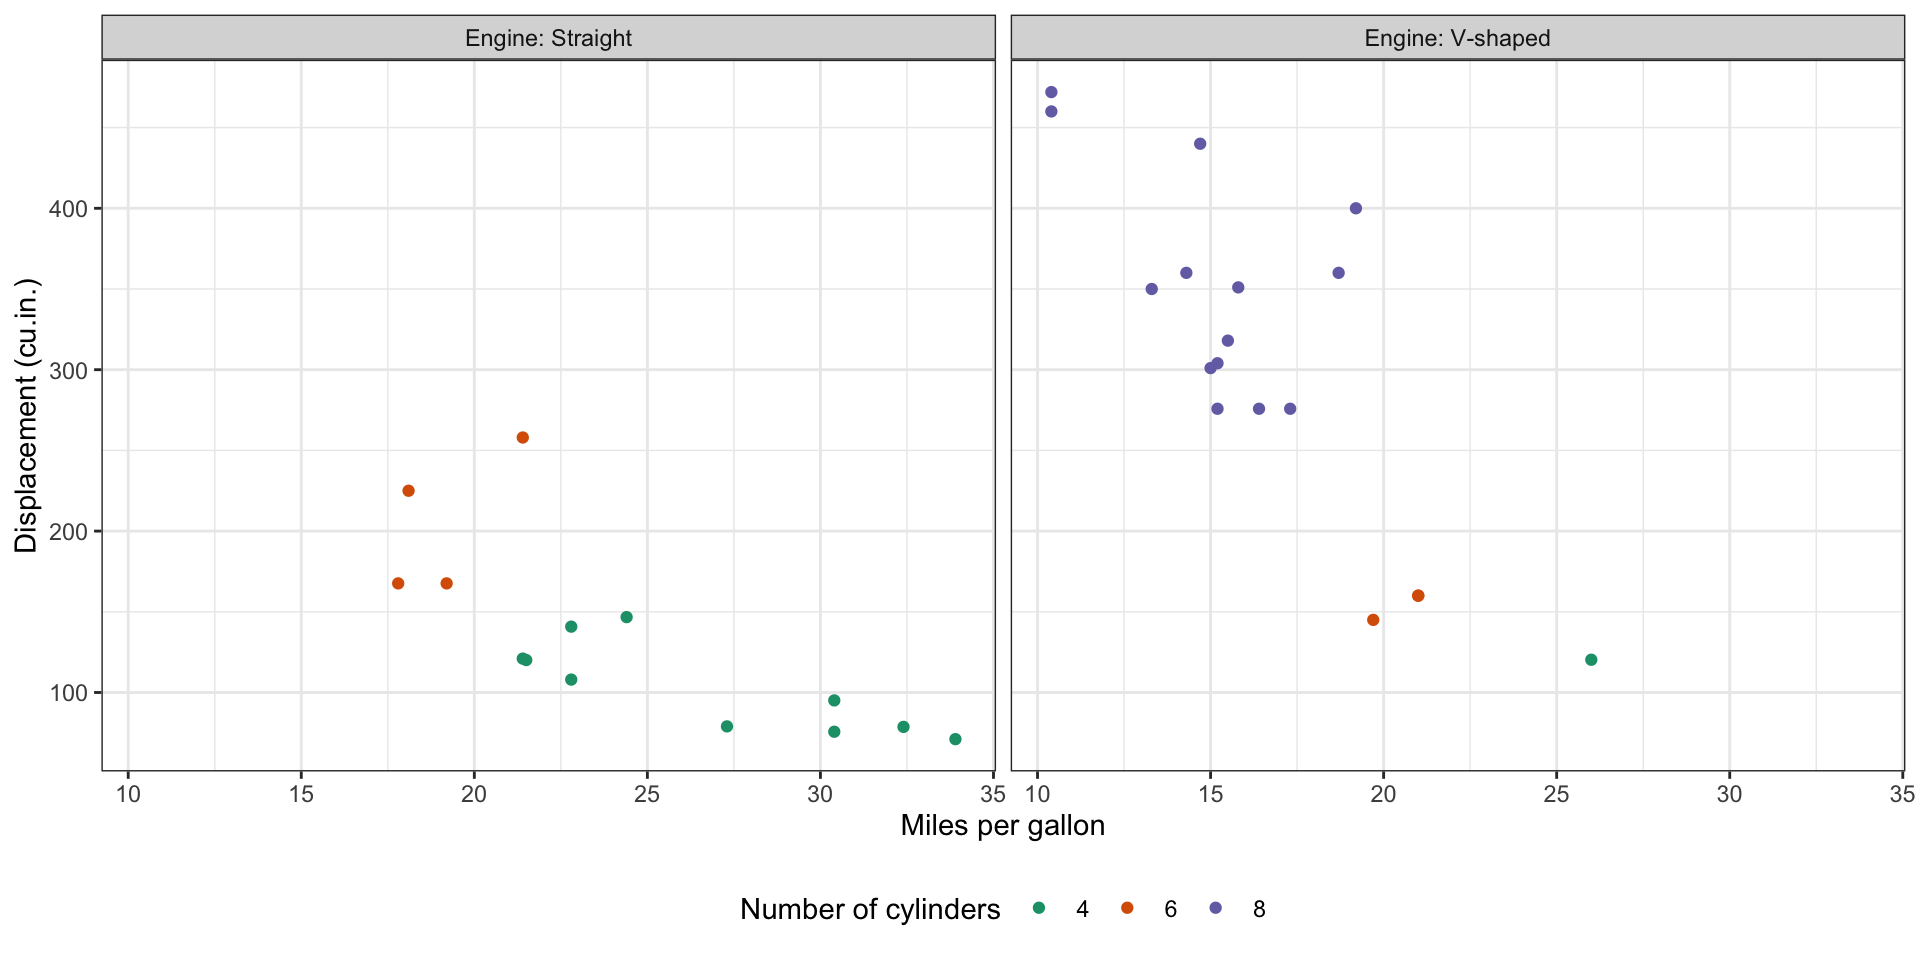
Larger engine displacement means a greater volume of air must be filled, requiring more fuel per cycle to maintain combustion and directly causing a lower miles-per-gallon (MPG) rating.
Visualization with ggplot2
Visual principles
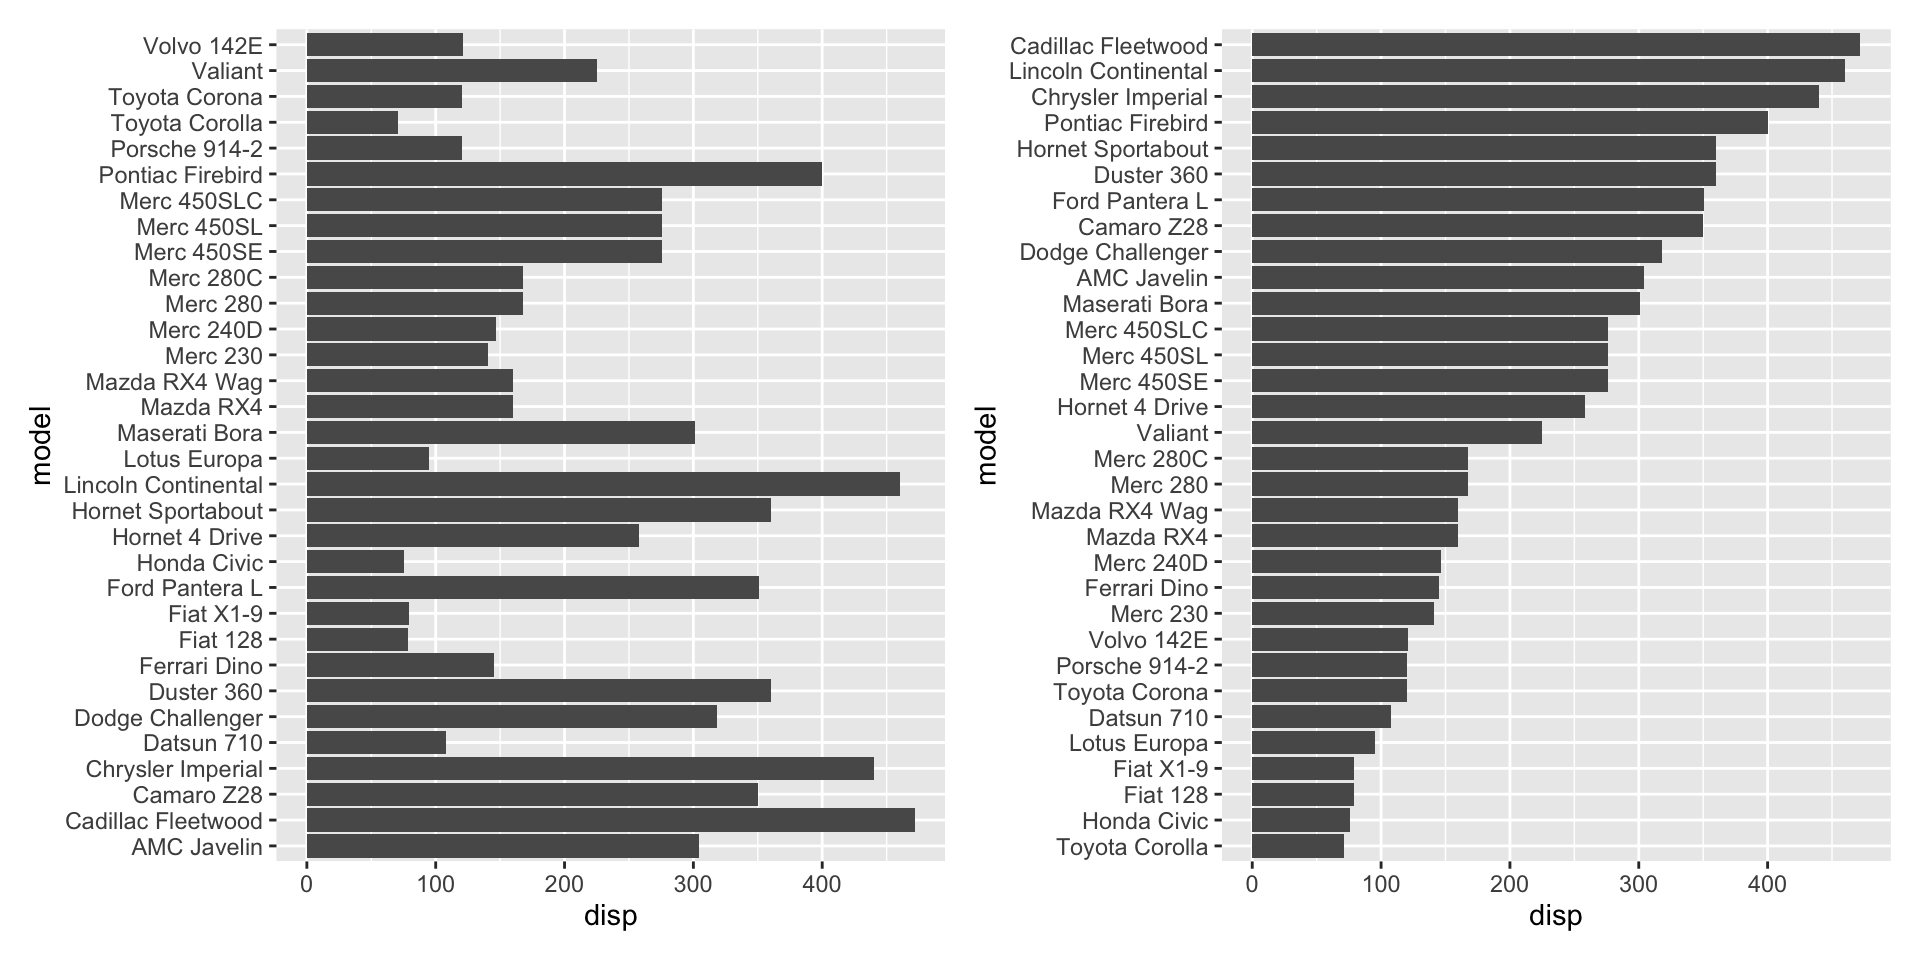
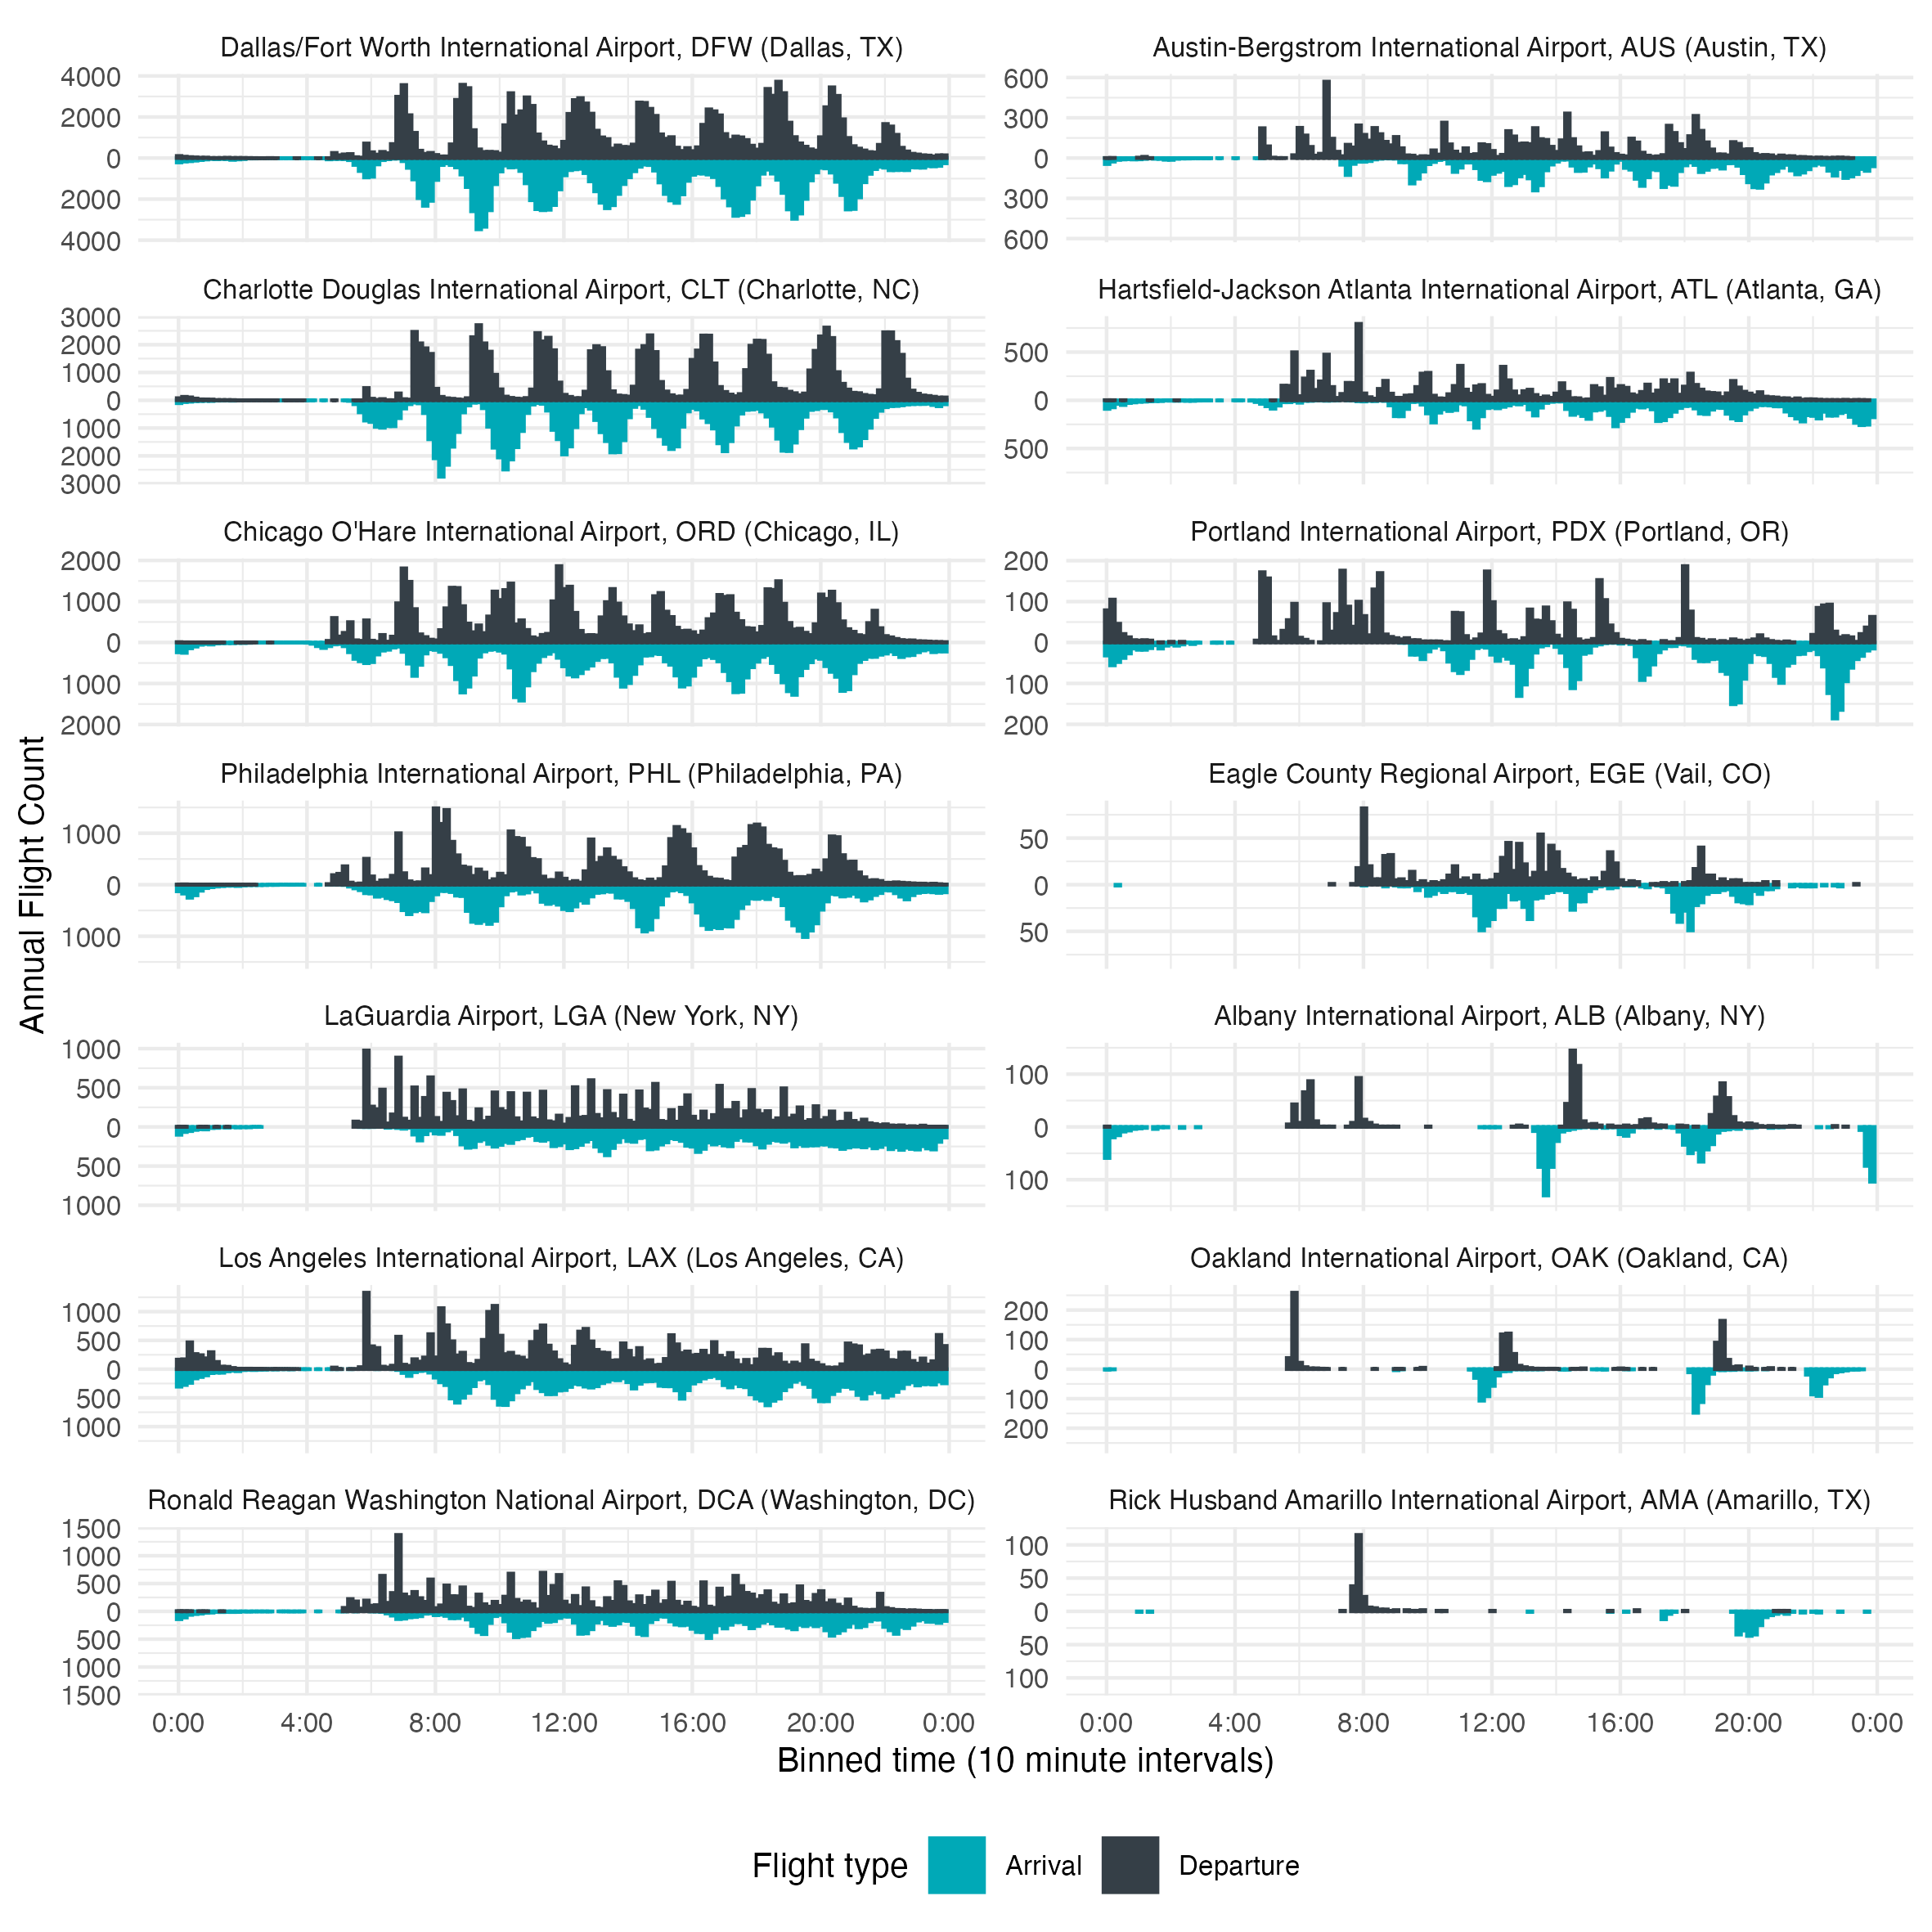
In the case study, you will create plots like …
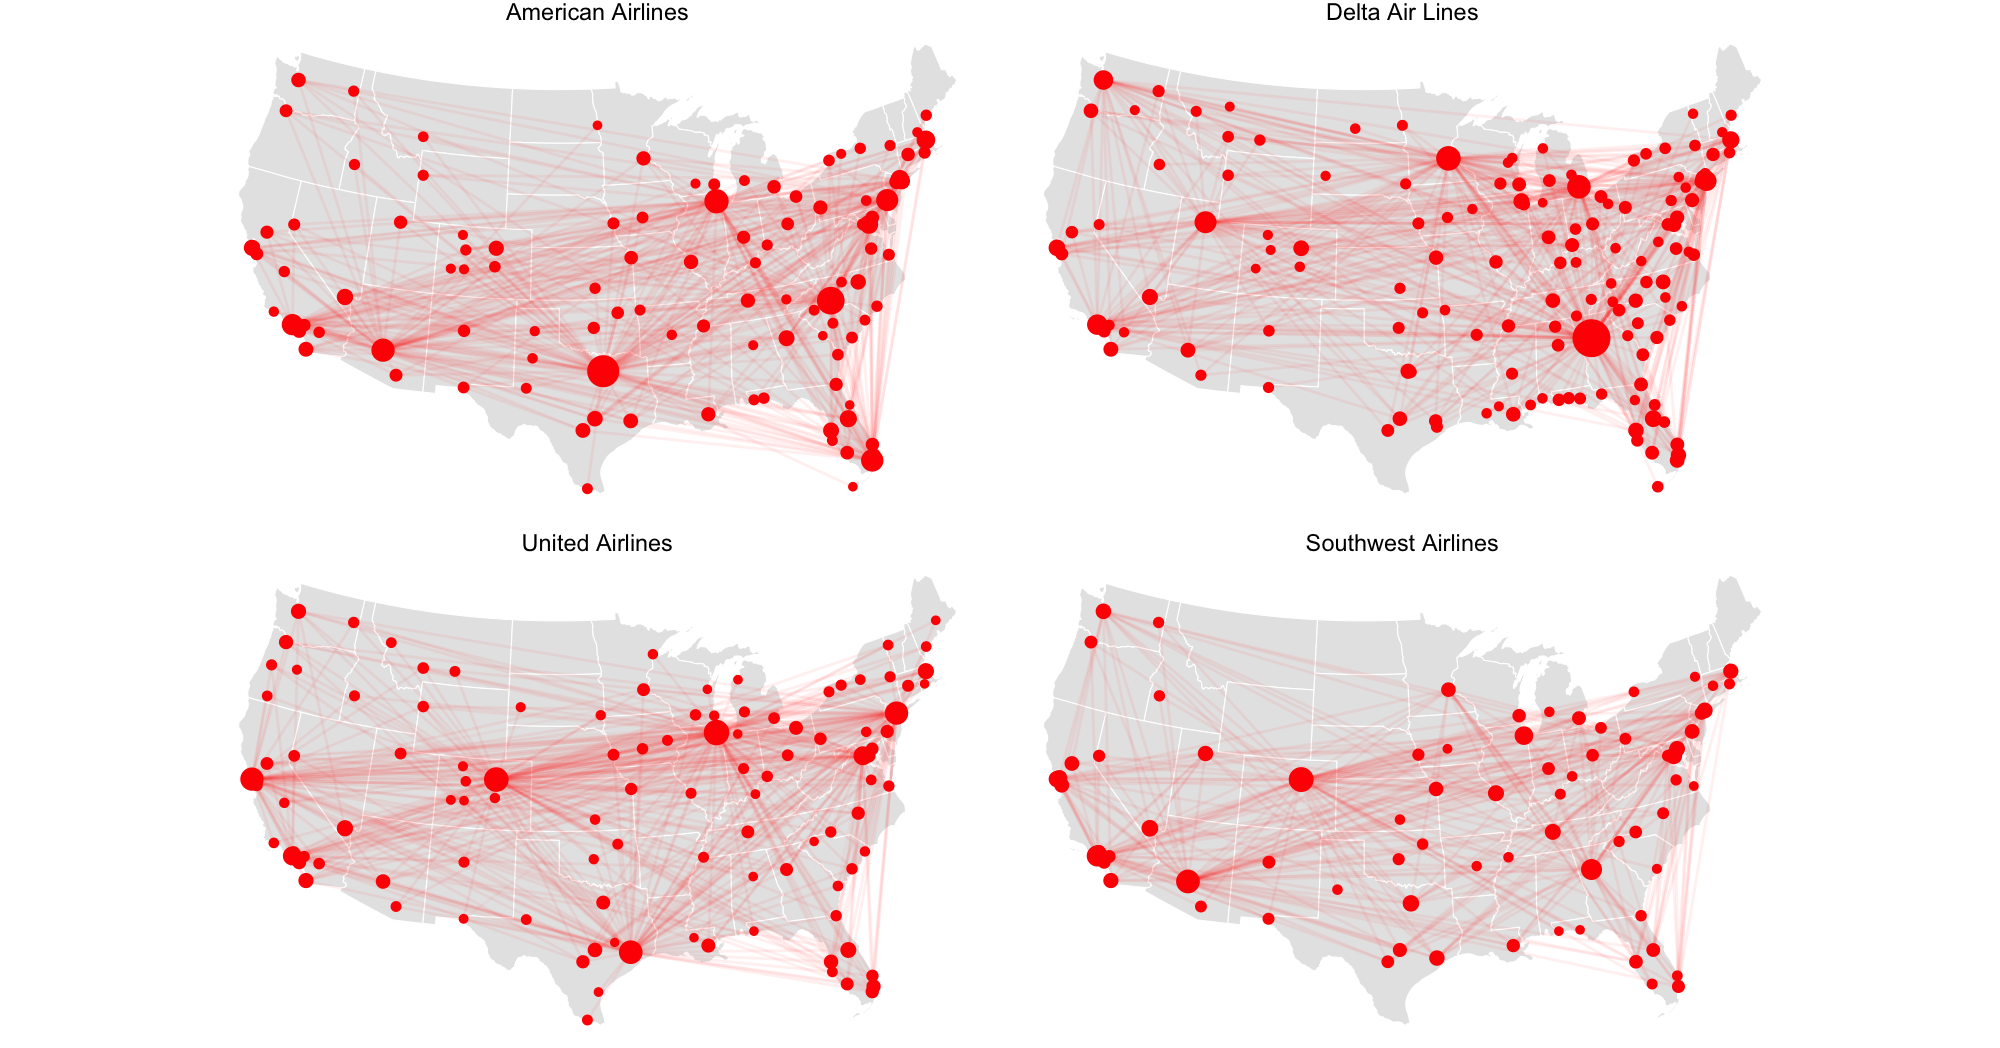
In the case study, you will create plots like …
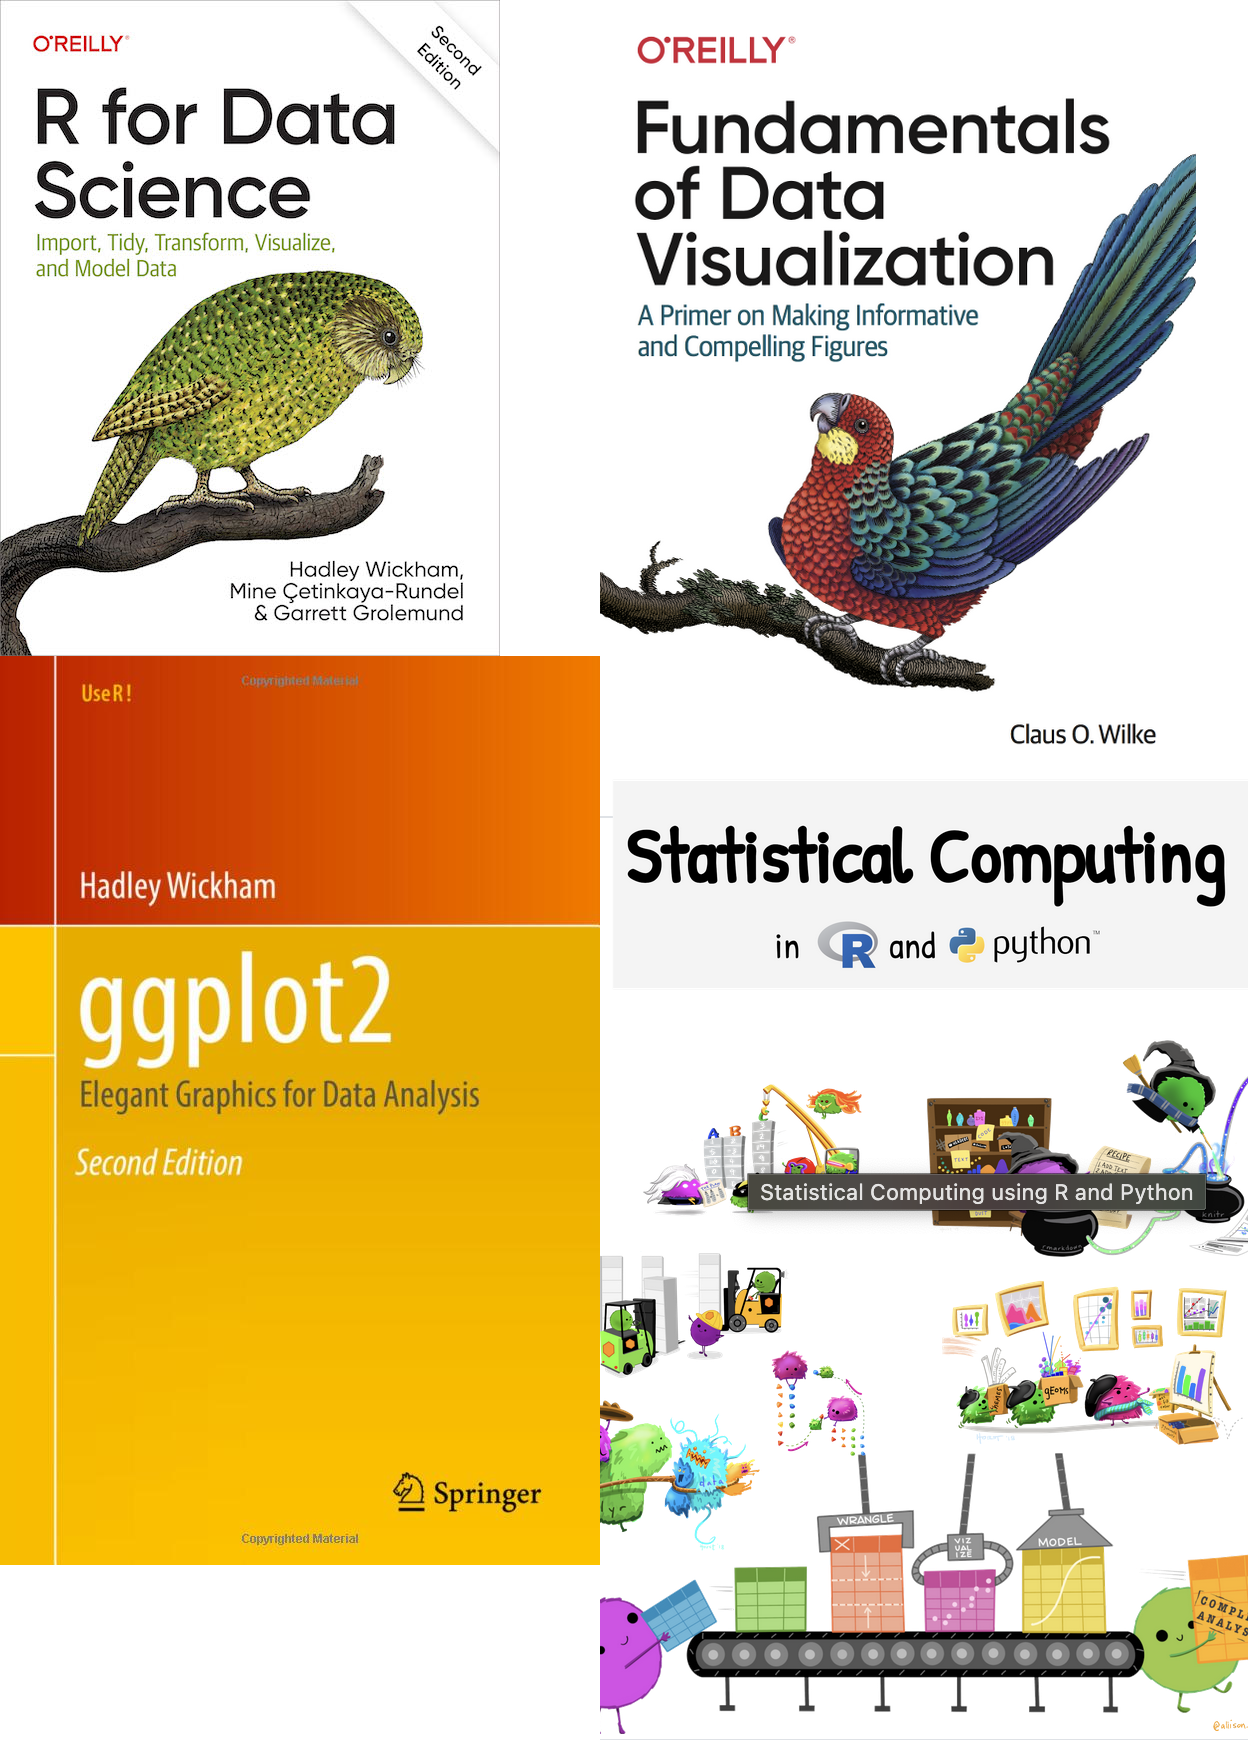
Textbooks
- R for Data Science by Hadley Wickham, Mine Çetinkaya-Rundel, and Garrett Grolemund: https://r4ds.hadley.nz/
- ggplot2: Elegant Graphics for Data Analysis (3e) by Hadley Wickham, Danielle Navarro, and Thomas Lin Pedersen: https://ggplot2-book.org/
- Fundamentals of Data Visualization by Claus O. Wilke: https://clauswilke.com/dataviz/
- Statistical Computing using R and Python by Susan Vanderplas: https://srvanderplas.github.io/stat-computing-r-python/
We will not learn Python in this course.
Class materials - course website
https://huizezhang-sherry.github.io/SDS322E/
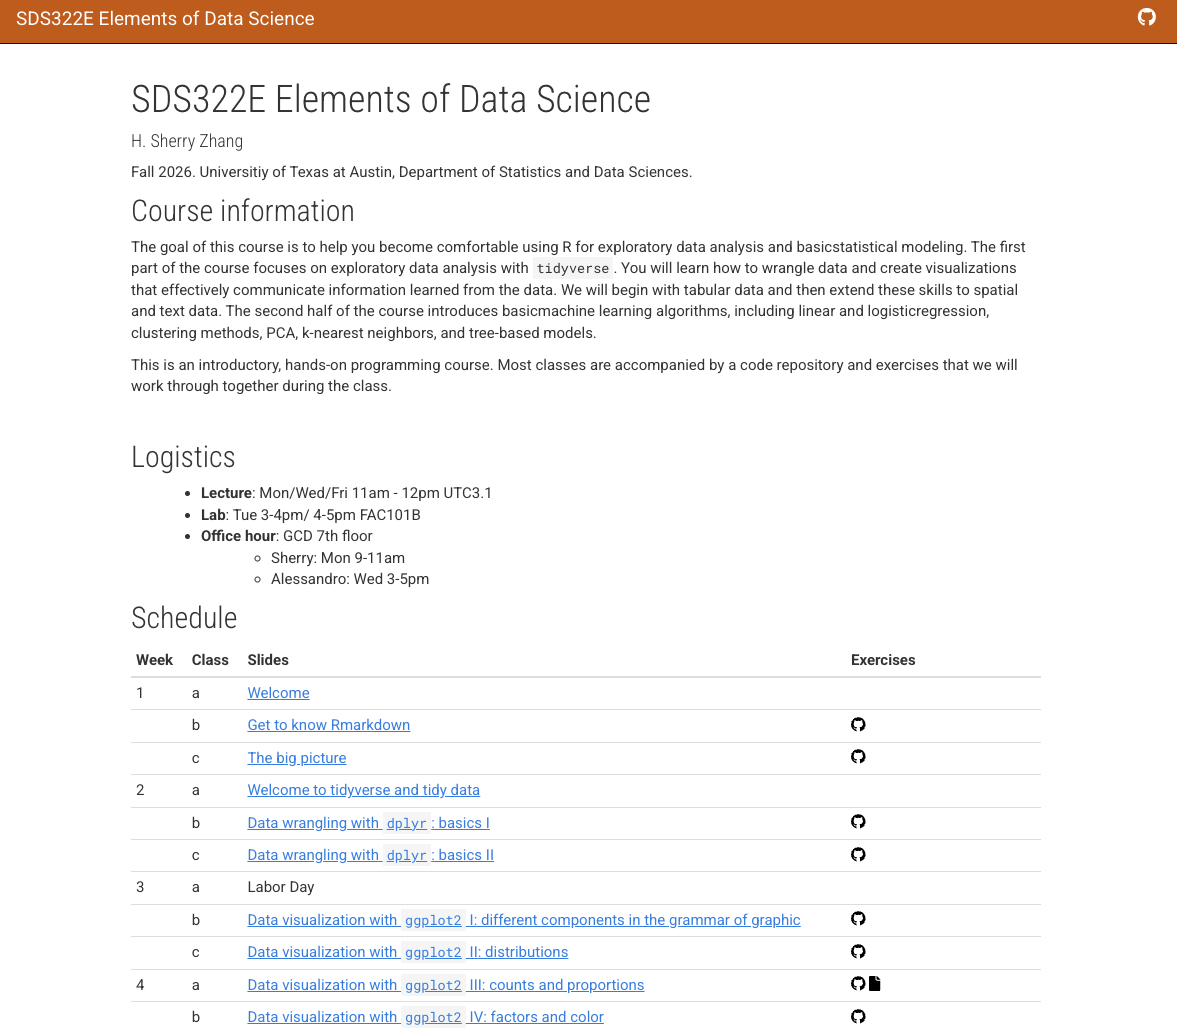
You can view the slides in HTML
Class materials - GitHub organization
https://github.com/SDS322E-26Fall
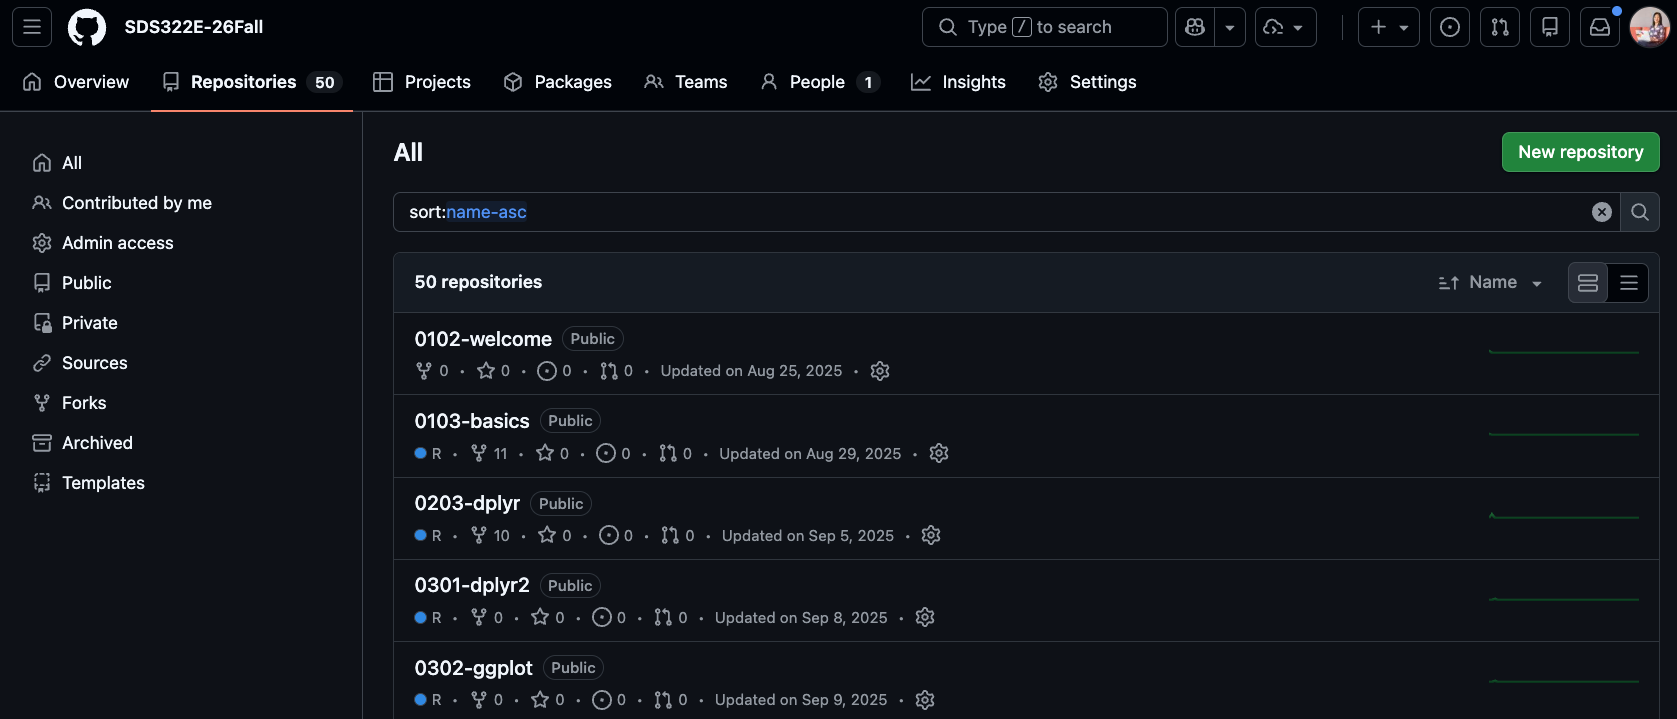
The repository contains all the class exercises and assessment materials (Lab, Homework, and Projects).
We will instruct you how to get those materials for the class on Wednesday.
RStudio IDE
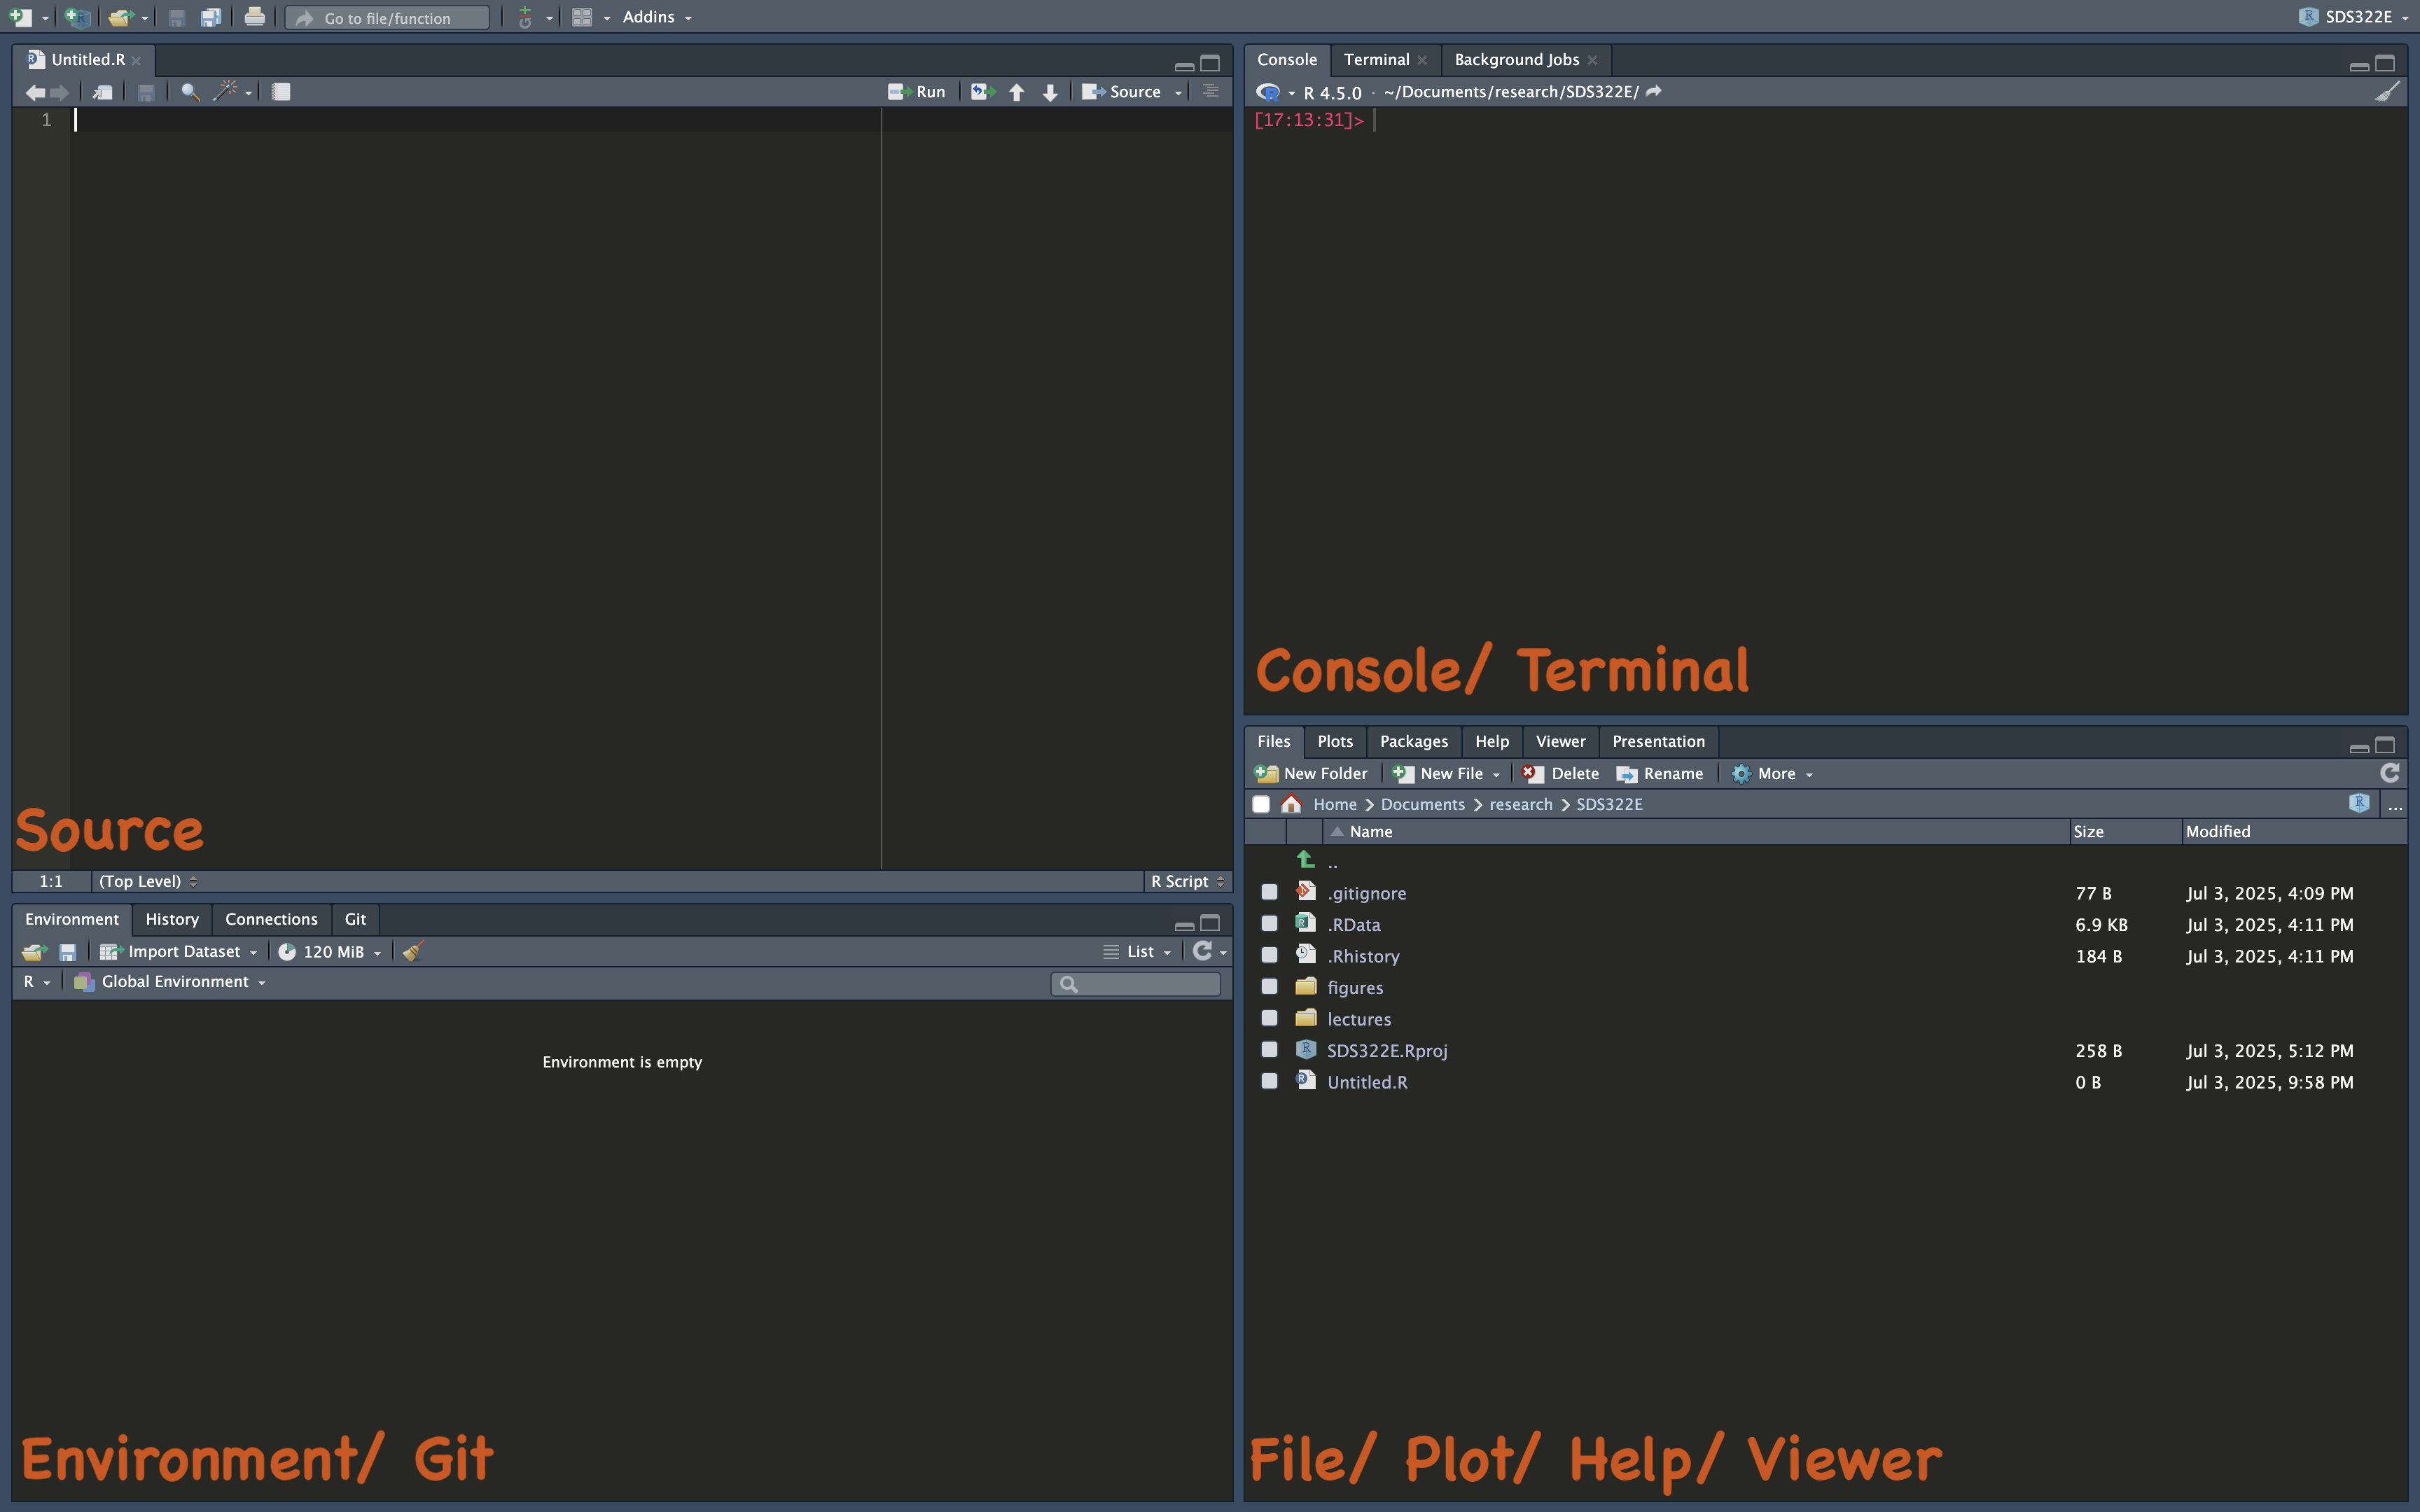
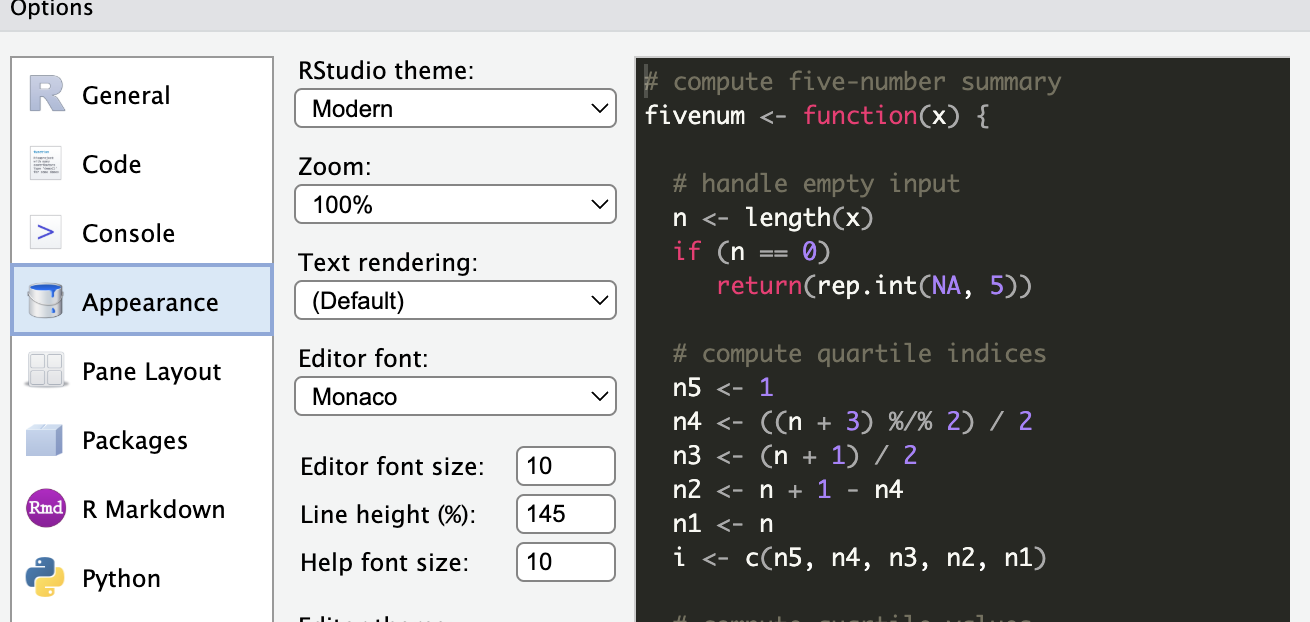
Change the appearance of your RStudio IDE
- Go to
Tools > Global Options(or PressCommand + ,) to pull out the options panel - Select the Appearance tab and find your favorite Editor font and theme