Elements of Data Science SDS 322E
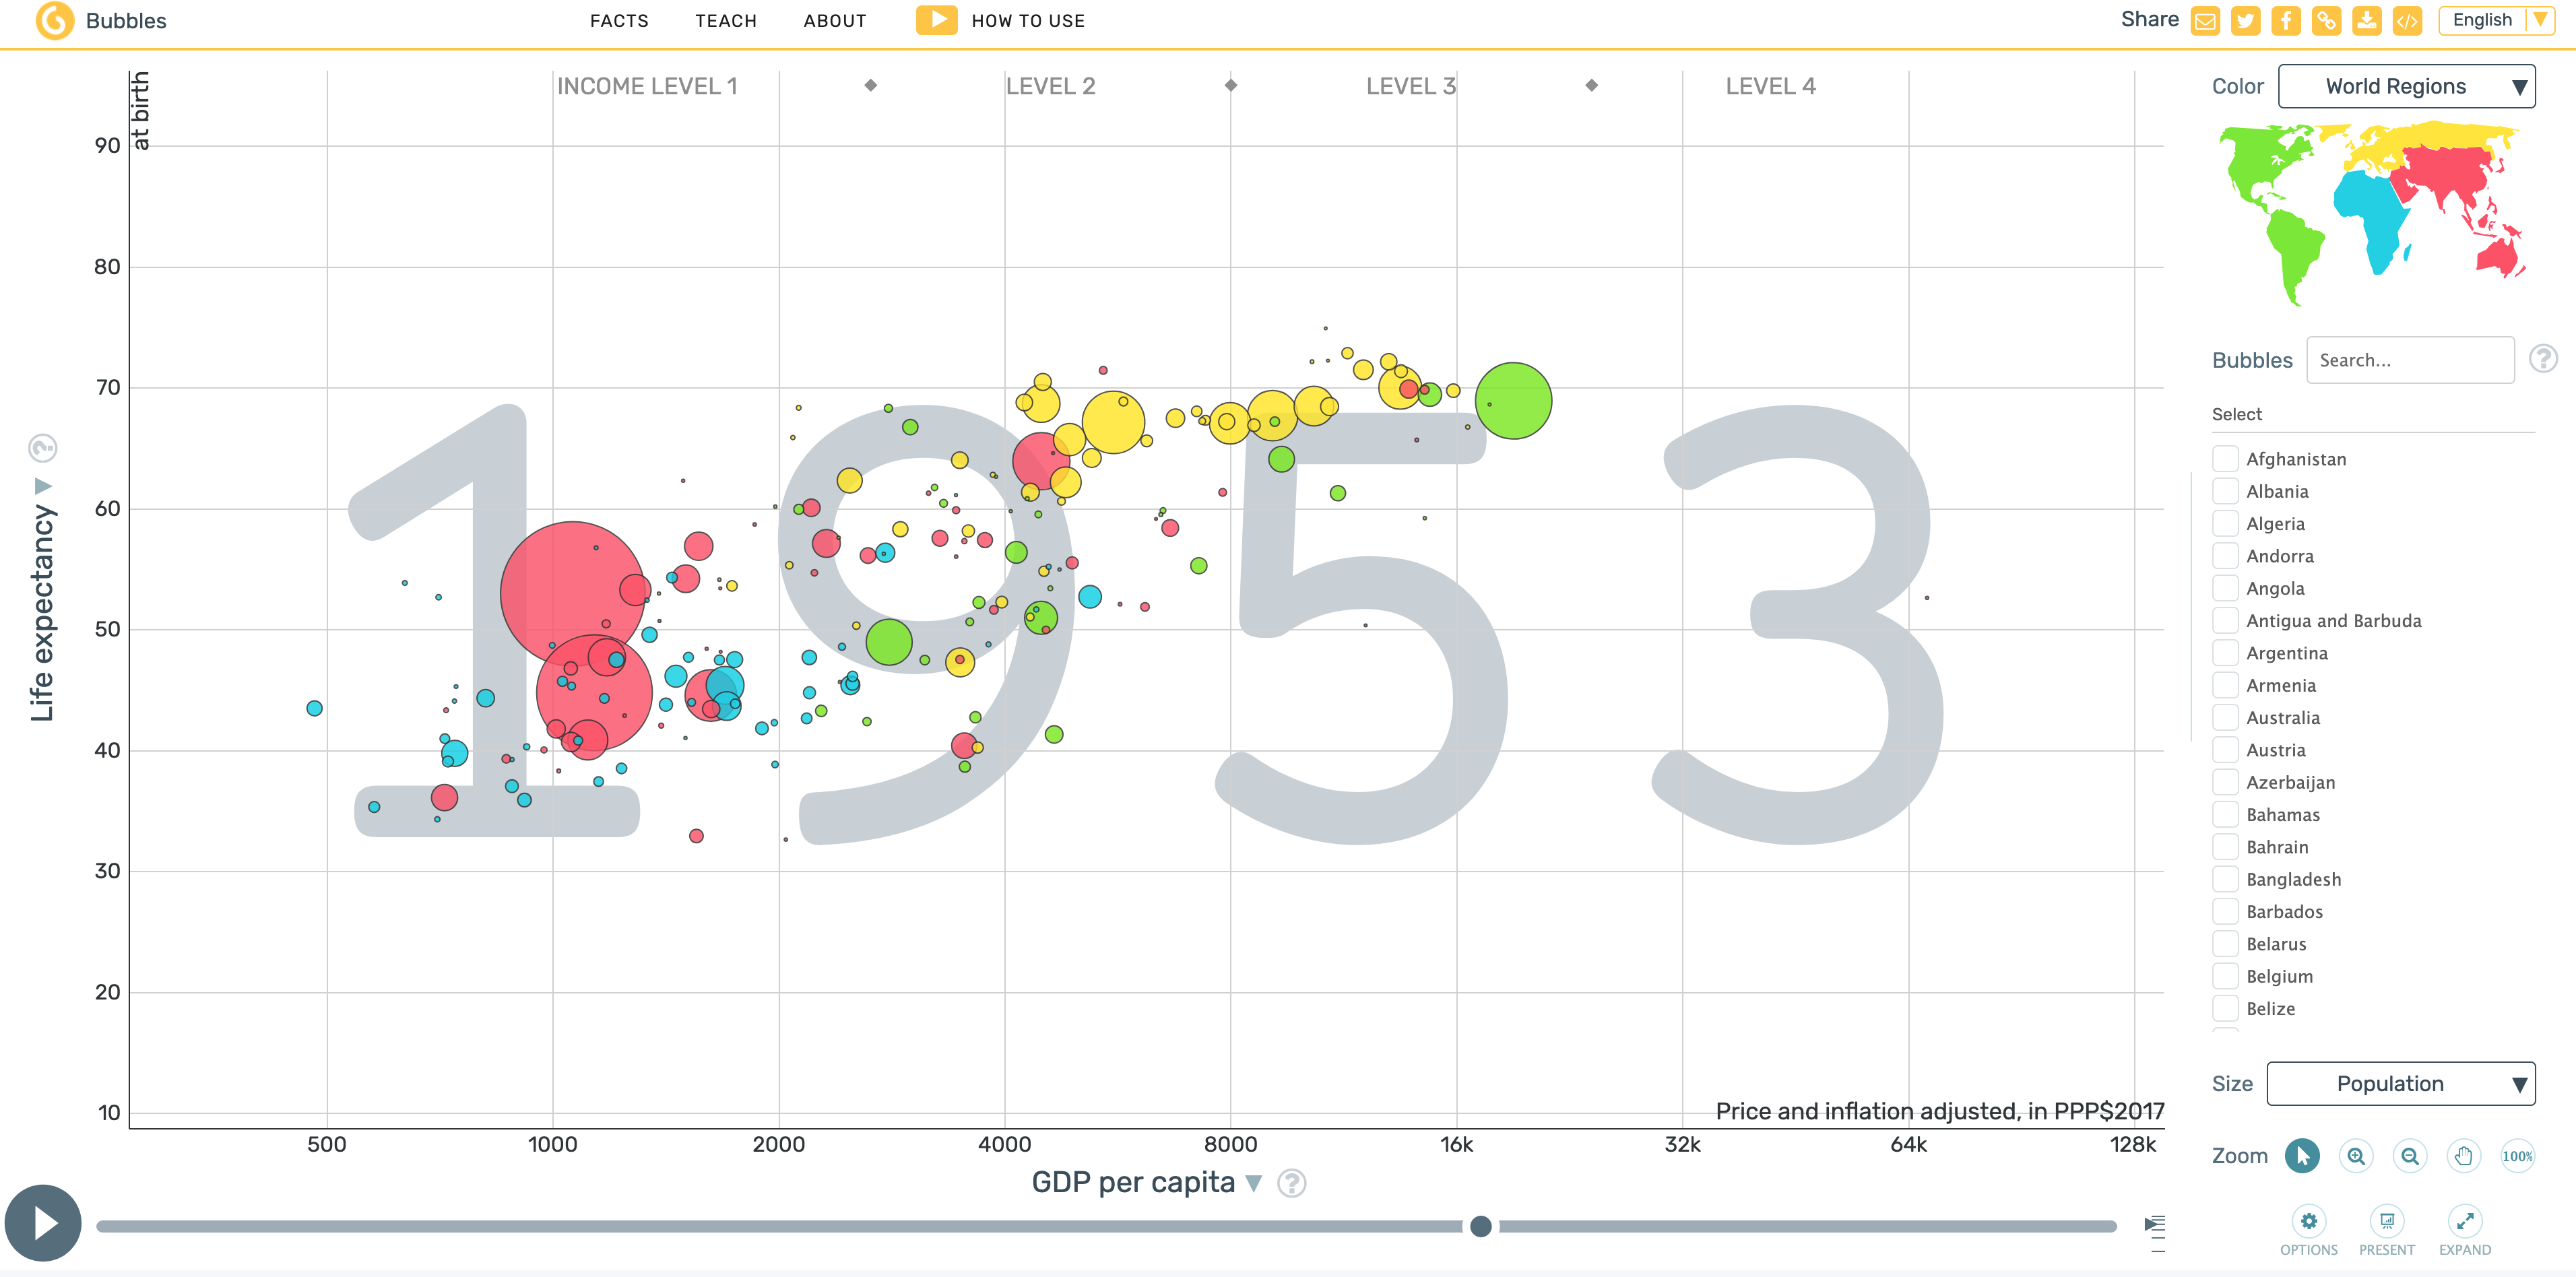
Remember the gapminder animation?
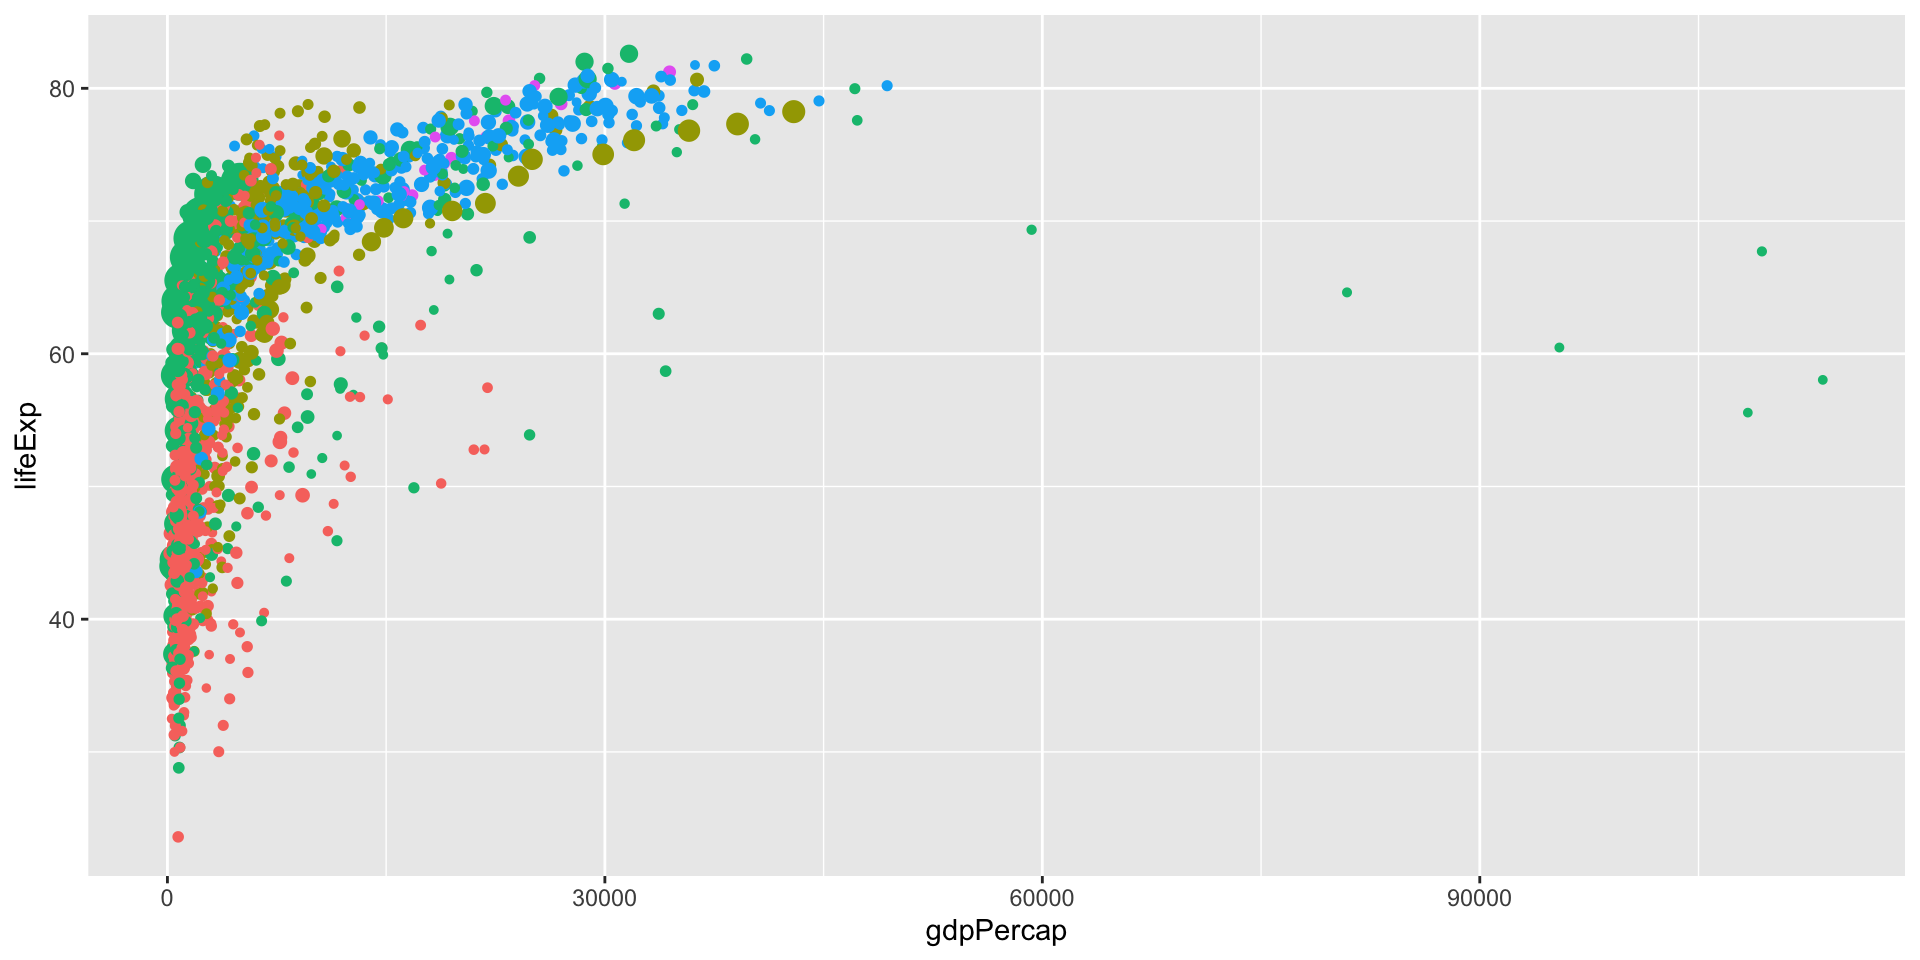
Start from a static plot
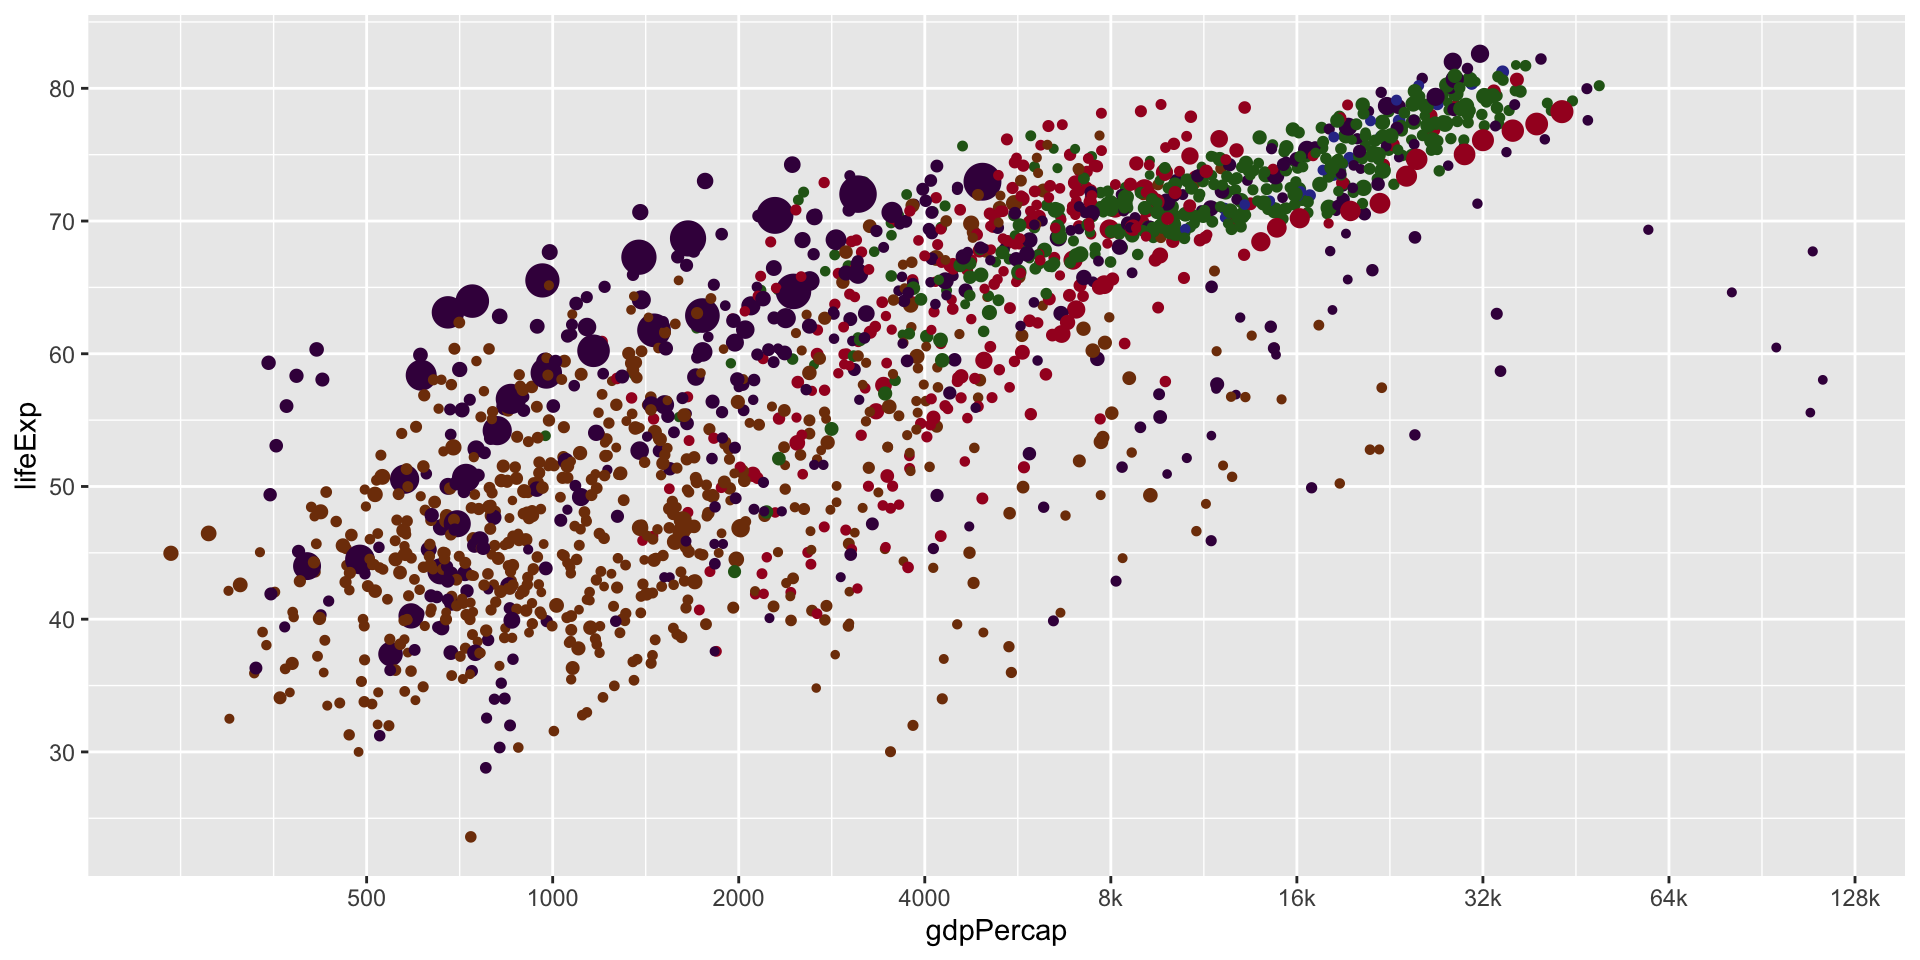
Add some color
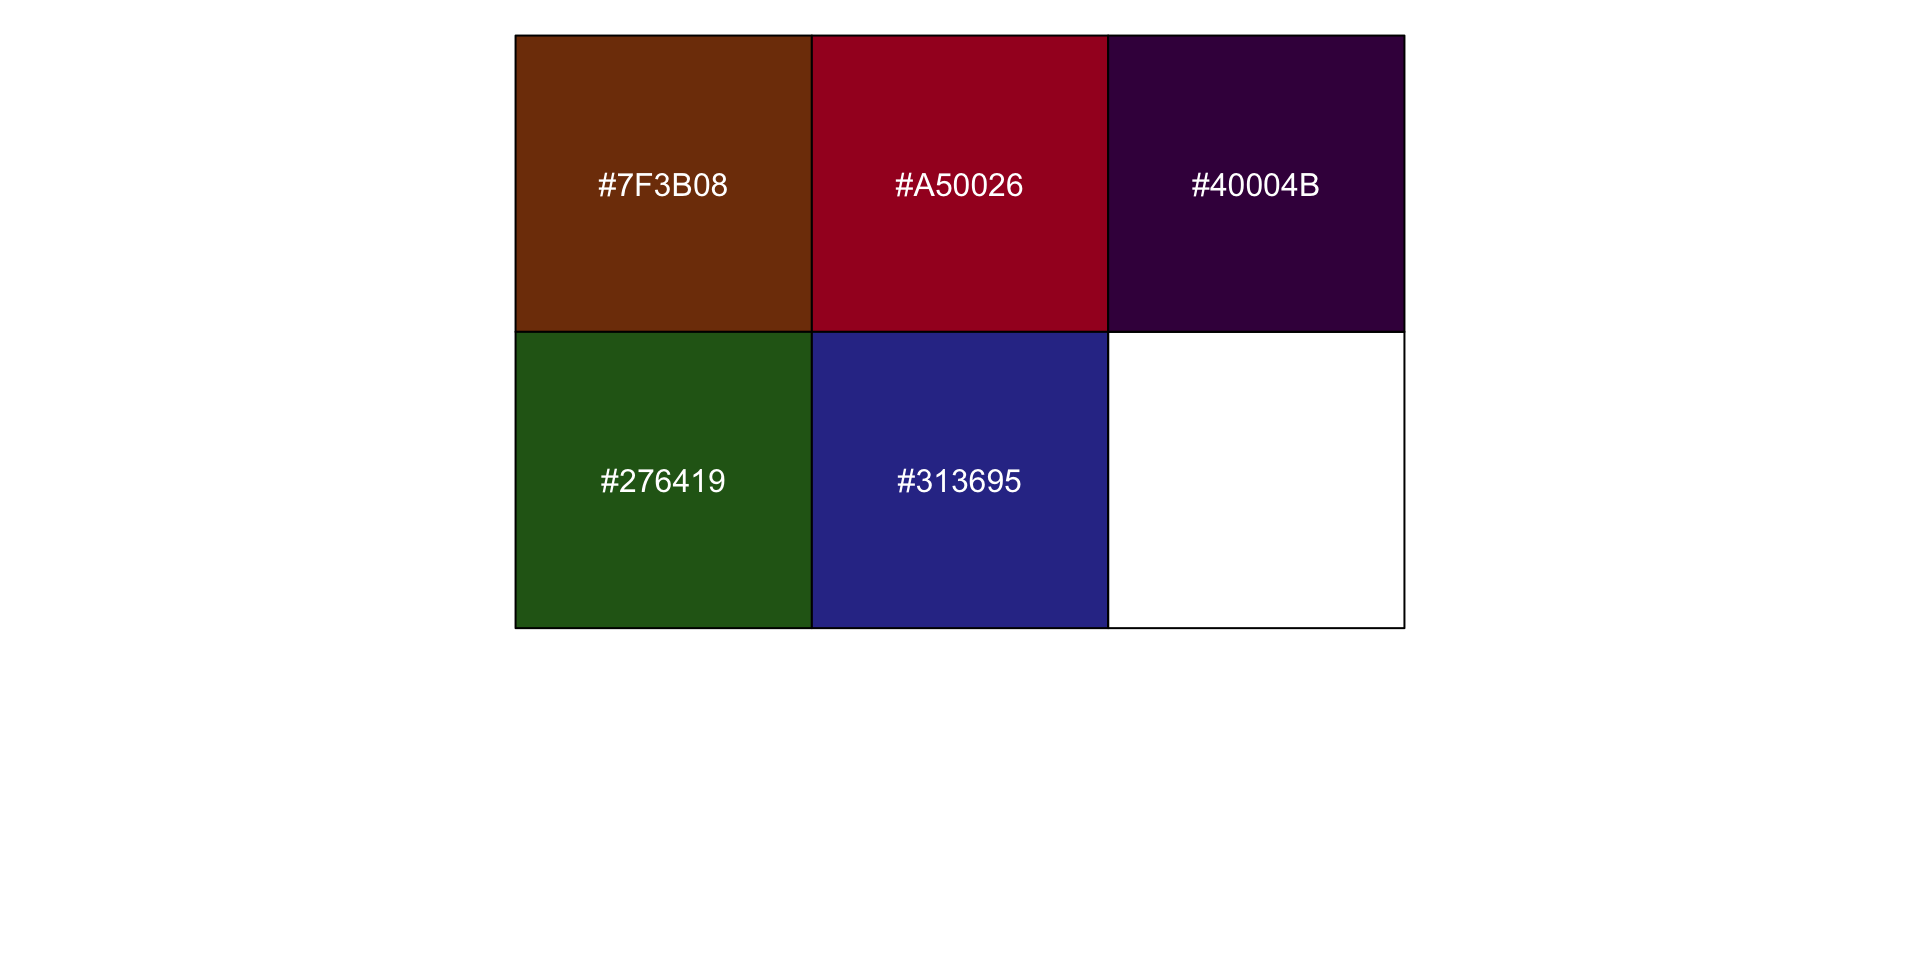
Add some color
Animation with gganimate
Animation with gganimate
Your time
- We may also want to add a label to indicate which year is the current frame. Read the documentation of
transition_time()and produce the following plot.
- To save the animation as a GIF file, use the
anim_save()function. Read the documentation and save your animation as a GIF file.